The latest 2025-26 production projections point to a record 16.8 billion bushels of corn on American farms, adrift historic acreage expansion.
In its September 12, 2025 Crop Production report, the National Agricultural Statistics Service (NASS) raised current corn acreage to 98.7 million acres.
This is a 9% improvement year-on-year (y-o-y) from the 2024 cultivated area and the most expansive in 92 years.
Out of this acreage, the NASS newly estimates the grain’s harvest area at 90 million acres or a 93% share.
The harvest swathe could have been higher but for a yield rate downsize to 186.7 bushels an acre. This is 2.1 bushels/acre down from the foregoing August 31, 2025 projection, but still 7.4 % better y-o-y.
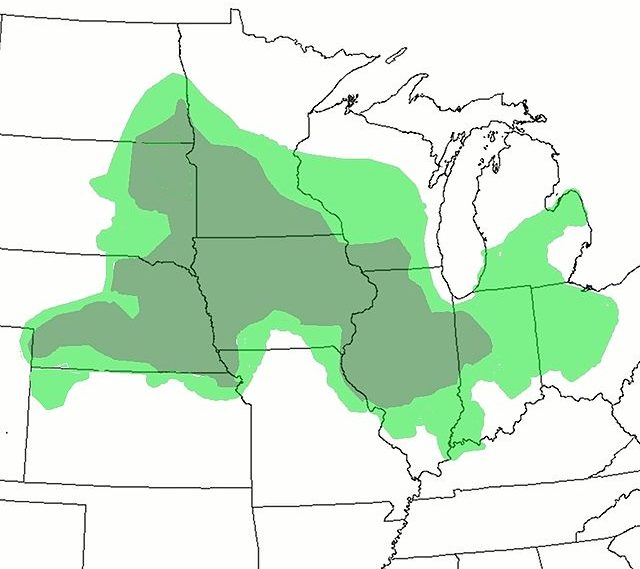
Driving these yield climbs is uptick production in corn belt states from Georgia in the south to Idaho in the north.
Production surveys before August 31 from some 7,600 corn and soy growers nationwide suggest a 67% good-to-excellent corn condition.
All the same, this positive forecast is worrying trade as it posits yet another year of U.S.’ corn price pressure.
According to Susan Stoud, the No Bull Agriculture’s analyst and founder, the latest yield rate downsize pales before the large acreage.
Traders in Chicago’s grain futures in turn temporarily downplay the acreage tide, biding their time till the USDA trims its forecasts.
What may not change much however are the corn ending stocks: though down to 2.11 billion bushels early September from end August’s prediction, they are still the highest since 2018.
So, will this latest forecast on corn acreage expansion affect trade profitability like the last Crop Progress report? The statistics below attempt an answer by reviewing past federal corn belt area totals in comparison with the current.
United States Corn Planted Acreage Statistics
The total planted area for corn and the harvested area are important pointers of grain production in the United States. On September 12, 2025, the USDA’s National Agricultural Statistics Service (NASS) estimated the planted acreage at 98.7 million acres. The below chart, mined from Y Charts and the USDA presents highlights of the historical planted area:
| Year | Planted Area [acres] |
| 2025 | 98.7 million [USDA’s September 12, 2025 estimate] |
| 2024 | 90.59 million |
| 2015 | 88.02 million |
| 2012 | 97.29 million |
| 2007 | 93.53 million |
| 2001 | 75.70 million |
| 1987 | 66.20 million |
| 1985 | 83.40 million |
| 1983 | 60.21 million |
| 1976 | 84.59 million |
Which states plant the most corn acres?
In 2023, Iowa was the top corn-growing state with 12.9 million acres, ahead of Illinois with 10.8 million. Following suit in the top five were Nebraska, Minnesota and South Dakota with 9.6, 8 and 5.75 million acres, respectively.
