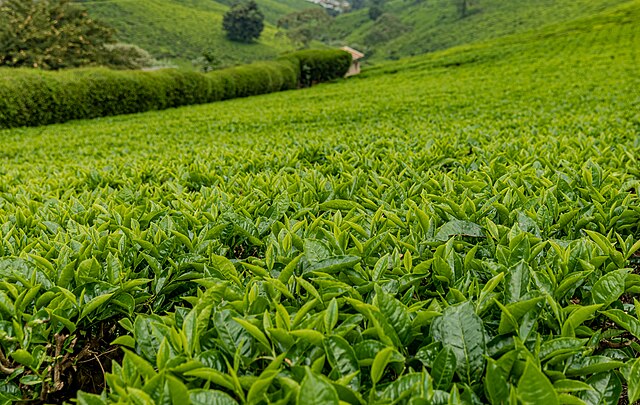
Despite Kenya registering a yearly volume fall from tea exports by 28.2 million tonnes halfway through 2025, shipments to India surged.
Nairobi dispatched 6,693.491 tonnes of tea to Mumbai in the January-June 2025 timeline, up from corresponding 2024’s 4,615.103 tonnes.
Accounting for the 45% surge were 300 subsidiary companies in India that imported the tea and blended it locally.
Duty-free trade agreements between the two Indian Ocean-bordering countries is contributing to the frequent shipment spikes.
Production Outlook
In Kenya, production in the first half of 2025 eased heavily, even stabilizing tea prices at auctions. The median price in Mombasa for the week ending September 1, 2025 however slid by US¢11, to $1.97 a kg.
The Tea Board of Kenya attributed falling production to low saturation in April 2025, when monthly volumes shed 3.8% annually, to 51,780 tonnes.
This had a knock-off effect on the January-June 2025 exports at 274,600 tonnes versus 302,800 tonnes a year back.
The commodity reached 53 foreign destinations during the foregoing half year, out of which Pakistan topped shipments while India registered growth.
Assam versus Import Tea
This is not the first time that the subcontinent is begrudging the rapid growth of imports at the expense of Assam tea.
Indeed, India suddenly found itself Kenya’s biggest tea importer in the January-October 2023 period when shipments surged 288% annually. During that 10-month window, the TBK recorded exports to India at 13,710 tonnes, up from 3,530 tonnes a year earlier.
The current trade alarm owes to India’s position as the second biggest global tea producer, hence domestic farmers’ protectionism.
Camellia sinensis (tea) growers from the Assam valley region in northeast India have to compete with comparatively cheaper imports.
In October 2024, Kenya’s tea in India averaged 156.73 rupees ($1.78) a kg while auctioned Assam cost 252.83 rupees ($2.88)/kg.
Dependence on imports owes to demand and ebbing production in Assam, which lost 50,000 tonnes in 2024, y-o-y.
But with Kenya’s production possibly peaking yet again during the short rains this October, exports to India could mount again. The below statistics look further at the harvest data of the breakfast staple in the East African country.
Kenya Tea Production and Exports Statistics
Kenya is the world’s third biggest tea producer and exporter, owing to its cool highlands that mature tea leaves year-round. Export of fresh tea leaves helps earn the country 26% of its foreign money or 4% of the GDP. Although production has downsized in the current decade, it hit its most recent heights in 2020. This coincided with an acreage surge to 269,400 hectares, per the FAOSTAT table below:
| Year | Production [tonnes] | Acreage [Ha] |
| 2023 | 2,577,800 | 227,800 |
| 2022 | 2,418,200 | 225,800 |
| 2021 | 2,430,900 | 219,000 |
| 2020 | 3,050,000 | 269,400 |
Which is Kenya’s place in world tea production and exports?
In 2024, tea production reached around 2,326,000 tonnes, making Kenya the third biggest global producer. Only India (5.969 million tonnes) and China (over 14.5 million tonnes) picked more. Kenya also emerged 3rd among worldwide tea exporters at $1.41 billion or 18.7% share, after China and Sri Lanka. India, a major importer of Kenya’s tea, finished 4th with exports worth $816.9 million.
Where does tea grow in Kenya?
According to the Tea Board of Kenya, there are two behemoth regions for tea production: the west Rift and the East Rift. In 2022, the West Rift, which includes Kericho, harvested 1,537,904 tonnes while the East Rift garnered 736,031.319 tonnes. Other than leader Kericho, key production counties include Bomet at 412,947.191 tonnes (2022) and Nandi at 369,808.464 tonnes (2022). Murang’a in the central region comes fourth at 201,752.575 tonnes (2022).
