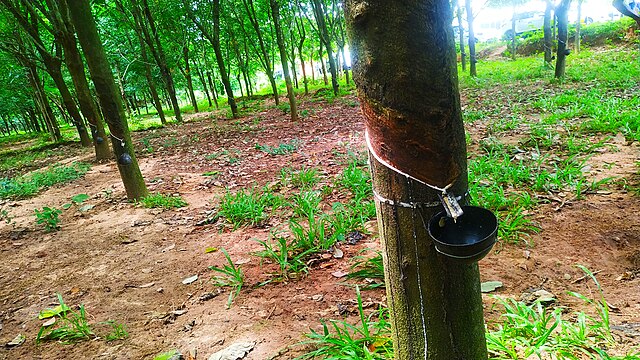
Importers China and India are riveted by falling global natural rubber prices involving a wait-and-see trade game.
India was in mid-August 2025 importing RRS-4 quality rubber at 190 rupees ($2.17) a kg, down from 213 rupees ($2.43) earlier.
Busy exploiting an import gap of lately inactive China, the subcontinent awaits 40,000 tonnes of rubber this August.
The south Asia nation imported 30,000 tonnes in July, an indicator that it is buying bulk while rates remain low.
India converts natural rubber into textiles and tyres whose shipments to the United States bring 7.6 billion rupees ($86.9 million) annually.
China & Price Fall
While India is taking advantage, China has cut purchases temporarily from either low demand, economical downturn or preliminary tariff assessment.
Analysts think it a strategic ploy by Beijing to bring down international rates for future ease of access.
The premise holds water since China accounts for 40-45% of worldwide rubber imports, most of which for its auto industry.
This is happening at a strategic timing when raw rubber should be naturally expensive: major origins in southeast Asia such as Malaysia have paused production due to rainy conditions.
Instead, rubber futures in the U.S. were down to $1.7 per kg on August 15, just after a fortnight high.
Many in stateside think the price fall underlines slowing economic growth in China in July 2025, when unemployment rates surged.
The inside view in China itself is in form of companies positioning themselves to absorb the U.S.’ tariffs. Sumitomo Rubber Industries, for instance, says it will partially cut expenditure and pass some costs to consumers, per the European Rubber Journal.
What remains of interest is how global natural rubber prices will alter as soon as demand in China returns. Also intriguing is how rains in Thailand, Malaysia and regional tapping hubs will impact rates in coming weeks. The following section offers the bigger picture of the important international sector.
Global Rubber Statistics
Southeast Asia’s trio of Malaysia, Thailand and Indonesia produce 80% of global rubber, while Ivory Coast, Nigeria and Liberia lead Africa’s tally. About 94% of the worldwide rubber exports are of Asian origin and a big remainder from Africa, per the World Bank. Production and export concentration to just a few geographical corners has created a monopoly that easily shifts prices. Indeed, rates have changed much across the decades, per the table below, courtesy the Federal Reserve Bank of St. Louis.
| Year | Natural Rubber Price [$/pound] |
| April 2025 | 0.988 |
| February 2011 | 2.807 |
| June 2008 | 1.461 |
| December 2001 | 0.221 |
| April 1995 | 0.835 |
| March 1990 | 0.375 |
How are global natural rubber imports distributed?
Industrialized nations are the main buyers of rubber for manufacturing tyres and making mats and similar. In 2024, China bought 23% of natural rubber worth $4 billion, and accounted for almost 40% of all global rubber imports. Next was the United States with a 10.8% natural rubber import share worth $1.8 billion. Malaysia and Japan with 9.8% and 7.5%, respectively, came next, while India ranked fifth with 6.3% worth $1.1 billion.
Who produced most rubber in 2022?
Thailand topped worldwide rubber production at 4.825 million tonnes in 2022, followed by Indonesia, Vietnam and Ivory Coast.
